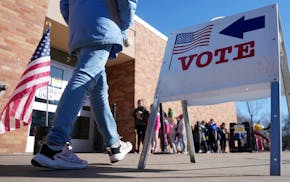
The Star Tribune and MPR News interviewed 500 Minnesota registered voters aged 18-34 between Feb. 17 and Feb. 21. Findings from questions about younger voters are below. Totals may not add up to 100% due to rounding. Scroll down the page for details about how the poll was conducted and the demographics of the 500 respondents.
How likely is it that you will vote in the general election for President in November 2020?
Definitely will vote Probably will vote May or may not vote Probably won't vote Definitely won't vote 55% 21% 13% 9% 2% Definitely will vote Probably will vote May or may not vote Probably won't vote Definitely won't vote TOTAL 55% 21% 13% 9% 2% Hennepin/ Ramsey 59% 21% 8% 10% 2% Rest of metro 54 25 11 9 1 Rest of state 52 19 19 9 1 Men 55 21 12 10 2 Women 55 21 14 8 2 DFL/ Democrat 60 19 10 10 1 Republican 51 22 15 10 2 Independent/ other 52 24 16 6 2 Under $50,000 45 23 17 14 1 $50,000 and over 65 20 8 5 2 No college degree 38 28 17 15 2 College graduate 75 14 7 2 2 Are you optimistic or pessimistic about your future?
Optimistic Pessimistic Neither/ not sure 75% 22% 3% Optimistic Pessimistic Neither/ not sure TOTAL 75% 22% 3% Hennepin/ Ramsey 81% 17% 2% Rest of metro 71 25 4 Rest of state 72 24 4 Men 76 21 3 Women 75 22 3 DFL/ Democrat 75 22 3 Republican 80 16 4 Independent/ other 71 26 3 Under $50,000 73 25 2 $50,000 and over 80 17 3 No college degree 77 21 2 College graduate 74 22 4 Are you optimistic or pessimistic about the future of your country?
Optimistic Pessimistic Neither/ not sure 59% 36% 5% Optimistic Pessimistic Neither/ not sure TOTAL 59% 36% 5% Hennepin/ Ramsey 57% 37% 6% Rest of metro 63 34 3 Rest of state 57 38 5 Men 59 35 6 Women 58 38 4 DFL/ Democrat 51 42 7 Republican 70 29 1 Independent/ other 60 35 5 Under $50,000 55 43 2 $50,000 and over 59 34 7 No college degree 59 37 4 College graduate 58 37 5 Are you optimistic or pessimistic about the future of the world?
Optimistic Pessimistic Neither/ Not sure 59% 34% 7% Optimistic Pessimistic Neither/ Not sure TOTAL 59% 34% 7% Hennepin/ Ramsey 60% 36% 4% Rest of metro 62 28 10 Rest of state 55 36 9 Men 55 39 6 Women 63 29 8 DFL/ Democrat 56 39 5 Republican 65 28 7 Independent/ other 57 32 11 Under $50,000 62 34 4 $50,000 and over 60 33 7 No college degree 63 30 7 College graduate 55 38 7 Do you agree or disagree with the following statement?
'My generation is better off than my parents' generation was.'
Agree Disagree Not
sure 42% 45% 13% Agree Disagree Not sure TOTAL 42% 45% 14% Hennepin/ Ramsey 43% 49% 8% Rest of metro 43 37 20 Rest of state 39 47 14 Men 39 50 11 Women 44 40 16 DFL/ Democrat 39 52 9 Republican 40 43 17 Independent/ other 46 37 17 Under $50,000 48 40 12 $50,000 and over 36 48 16 No college degree 43 43 14 College graduate 40 47 13 Do you agree or disagree with the following statement?
'People like me have access to quality, affordable health care.'
Agree Disagree Not
sure 40% 52% 8% Agree Disagree Not sure TOTAL 40% 52% 8% Hennepin/ Ramsey 39% 54% 7% Rest of metro 44 45 11 Rest of state 37 56 7 Men 39 54 7 Women 40 50 10 DFL/ Democrat 34 60 6 Republican 52 40 8 Independent/ other 37 52 11 Under $50,000 31 60 9 $50,000 and over 53 41 6 No college degree 34 57 9 College graduate 47 45 8 Do you agree or disagree with the following statement?
'Climate change poses a significant threat to my community.'
Agree Disagree Not
sure 60% 32% 8% Agree Disagree Not sure TOTAL 60% 32% 8% Hennepin/ Ramsey 64% 26% 10% Rest of metro 62 33 5 Rest of state 53 38 9 Men 60 33 7 Women 59 32 9 DFL/ Democrat 71 22 7 Republican 44 51 5 Independent/ other 56 32 12 Under $50,000 59 36 5 $50,000 and over 58 36 5 No college degree 58 34 8 College graduate 61 30 9 Do you agree or disagree with the following statement?
'People like me have access to quality, affordable housing.'
Agree Disagree Not
sure 48% 41% 11% Agree Disagree Not sure TOTAL 48% 41% 11% Hennepin/ Ramsey 41% 48% 11% Rest of metro 53 35 12 Rest of state 51 38 11 Men 45 46 9 Women 50 36 14 DFL/ Democrat 35 53 12 Republican 64 27 9 Independent/ other 52 36 12 Under $50,000 45 43 12 $50,000 and over 50 39 11 No college degree 50 39 11 College graduate 47 42 11 Do you agree or disagree with the following statement?
'My generation will have a more positive impact on the world than my parents' generation did.'
Agree Disagree Not
sure 60% 16% 24% Agree Disagree Not sure TOTAL 60% 16% 24% Hennepin/ Ramsey 65% 11% 24% Rest of metro 63 12 25 Rest of state 53 24 23 Men 63 18 19 Women 57 14 29 DFL/ Democrat 67 9 24 Republican 52 27 21 Independent/ other 58 16 26 Under $50,000 61 19 20 $50,000 and over 62 11 27 No college degree 62 14 24 College graduate 58 18 24 About the poll
The findings of this Star Tribune/MPR News Minnesota Poll are based on live interviews conducted Feb. 17 to Feb. 21 with 500 Minnesota registered voters aged 18-34.Of this sample, 139 were obtained between Feb. 17 and Feb. 19 during interviews with 800 registered voters for a more expansive Star Tribune/MPR News Minnesota Poll. An additional 361 interviews with Minnesota registered voters aged 18-34 were conducted Feb. 20-21. This is commonly referred to as an "oversample." These additional respondents were only asked the questions pertaining to younger voters that were included in the poll.The interviews were conducted via landline (37%) and cellphone (63%). The poll was conducted for the Star Tribune and Minnesota Public Radio News by Mason-Dixon Polling and Strategy Inc.The sample for this survey was drawn from a Mason-Dixon database that includes approximately 2.2 million registered Minnesota voters who are matched with a telephone number — either a landline, a cellphone or both. A random sample of 100,000 voters from unique households with unique phones was drawn from this database for use in calling on this poll.Results of a poll based on 500 interviews will vary by no more than 4.5 percentage points, plus or minus, from the overall population 95 times out of 100. Margins are larger for groups within the sample, such as gender or income groups.The self-identified party affiliation of the respondents is 42% Democrats, 25% Republicans and 33% independents or other.Sampling error does not take into account other sources of variation inherent in public opinion surveys, such as nonresponse, question wording or context effects. In addition, news events may have affected opinions during the period the poll was taken.Readers can e-mail questions to matt.delong@startribune.com.Demographic breakdown of this polling sample
PARTY DFL/ Democrat 212 (42%) Republican 124 (25%) Independent/ other 164 (33%) INCOME < $25,000 66 (13%) $25,000-$49,999 129 (26%) $50,000-$74,999 99 (20%) $75,000-$99,999 59 (12%) $100,000+ 55 (11%) Refused 92 (18%) INTERVIEW Land-line 186 (37%) Cell Phone 314 (63%) GENDER Men 237 (47%) Women 263 (53%) REGION Hennepin/ Ramsey 189 (38%) Rest of metro 142 (28%) Rest of state 169 (34%) EDUCATION High school
or less 130 (26%) Some college/
Vocational 135 (27%) College graduate 155 (31%) Graduate degree 67 (13%) Refused 13 (3%)
Former DFL Senate Majority Leader Kari Dziedzic dies of cancer at age 62

How the Star Tribune is covering the 2024 election

Fact check: Walz and Vance made questionable claims during only VP debate

In Tim Walz's home city, opposing groups watch him debate on the national stage
