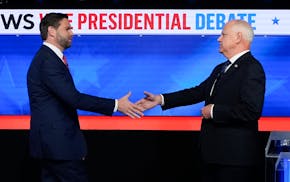
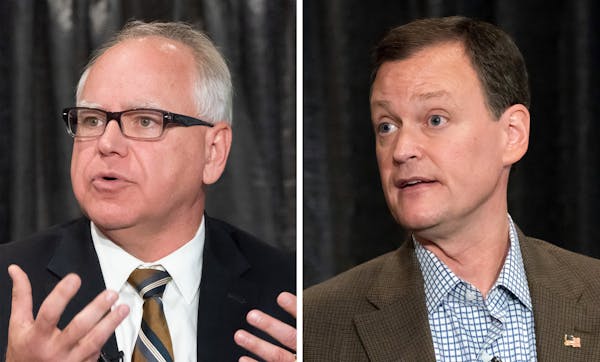
The Star Tribune and Minnesota Public Radio News polled 800 Minnesota likely voters between Sept. 10 and Sept. 12. Highlights from questions about the governor's race are below. Respondents were read the names of all candidates on the ballot; Chris Wright, the Grassroots-Legalize Cannabis candidate received the support of 2 percent of respondents, and Josh Welter, the Libertarian candidate, received the support of 1 percent. Scroll down the page to see details about how the poll was conducted and the demographics of the 800 respondents.
If the 2018 general election for Minnesota governor were held today, would you vote for...?
Tim Walz
(DFL) Jeff Johnson
(Republican) Other Undecided 45% 36% 3% 16% Tim
Walz Jeff
Johnson Other Undecided Men 40% 40% 4% 16% Women 50 32 2 16 Democrats 84 0 1 15 Republicans 2 90 1 7 Independents / other 40 26 7 27 18-34 62 17 3 18 35-49 42 33 5 20 50-64 39 41 2 18 64+ 42 45 1 11 Under $50,000 41 37 5 17 $50,000 and over 44 40 2 14 Hennepin / Ramsey 55 27 2 16 Metro Suburbs 39 42 5 14 Southern Minn. 48 34 2 16 Northern Minn. 35 43 2 20 Which one of the following issues is most important to you in your vote for governor?
All voters Walz voters Johnson voters Undecided voters Healthcare 25% 37% 12% 20% Quality of Public Education 18 24 9 22 The Economy & Jobs 16 11 22 17 Immigration 11 2 25 5 Taxes 10 3 18 9 Protecting the Environment 6 9 1 7 Crime & Public Safety 4 6 2 5 Gun Rights & Gun Control 2 2 2 4 Drug abuse & Opioid addiction 2 2 2 2 Transportation & Transit 2 1 2 3 Abortion 2 0 3 5 Affordable Housing 0 1 0 0 Not Sure 2 2 2 1 Do you recognize the name ______? (IF YES) Do you have a favorable, unfavorable or neutral opinion of ______?
Tim Walz Jeff Johnson Recognize Favorable 37% 26% Recognize Unfavorable 13% 24% Recognize Neutral 32 31 Don't Recognize 18 19 About the poll
This Star Tribune/MPR News Minnesota Poll findings are based on interviews conducted Sept. 10-12 with 800 Minnesota likely voters. The interviews were conducted via land line (60 percent) and cellphone (40 percent). The poll was conducted for the Star Tribune and Minnesota Public Radio News by Mason-Dixon Polling and Research Inc. Results of a poll based on 800 interviews will vary by no more than 3.5 percentage points, plus or minus, from the overall population 95 times out of 100. Margins are larger for groups within the sample, such as Democrats and Republicans, and age groups.
The self-identified party affiliation of the respondents is 37 percent Democrats, 31 percent Republicans and 32 percent independents or other.
Sampling error does not take into account other sources of variation inherent in public opinion surveys, such as nonresponse, question wording or context effects. In addition, news events may have affected opinions during the period the poll was taken.
Readers can e-mail questions to djmcgrath@startribune.com.
Demographic breakdown of this polling sample
PARTY DFL/Democrat 299 (37%) Republican 246 (31%) Independent/Other 255 (32%) AGE 18-34 152 (19%) 35-49 200 (25%) 50-64 226 (28%) 65+ 216 (27%) Refused 6 (1%) GENDER Male 377 (47%) Female 423 (53%) INCOME < $25,000 84 (10%) $25,000-$49,999 127 (16%) $50,000-$74,999 130 (16%) $75,000-$99,999 121 (15%) $100,000+ 125 (16%) Refused 213 (27%) REGION Hennepin/Ramsey 255 (32%) Metro Suburbs 230 (29%) Southern Minnesota 160 (20%) Northern Minnesota 155 (19%) INTERVIEW Land-line 483 (60%) Cell Phone 317 (40%)
Former DFL Senate Majority Leader Kari Dziedzic dies of cancer at age 62
How the Star Tribune is covering the 2024 election
Fact check: Walz and Vance made questionable claims during only VP debate
In Tim Walz's home city, opposing groups watch him debate on the national stage
